Ok, before I go on, I feel like I should make a disclaimer. I am not a blogging guru, nor am a Google Analytics guru. I am however a blogger who is trying to grow her blog, which I know a lot of you are.
If you not a blogger, and think this post sound boring, check out some of my more exciting posts, like my Cookie Dough Truffles or this DIY Chevron Canvas.
Now, onto the post. If you have a blog you have probably installed Google Analytics (I’ll now be calling it GA. Also, its free, so this isn’t an affiliate link)on it. If not, go do that now, it’s a great tool. Plus, if you are looking to do sponsored posts, most companies want your stats, that you can get from GA. Today I wanted to share with you how I’ve been using Google Analytics to assess my pageviews.

The main reason I used GA when I first installed it was to track page views, visits (labeled sessions in GA) and unique visitors (labeled users in GA). So lets look at my April views.
Here is a screen shot of how it looks when I sign in.
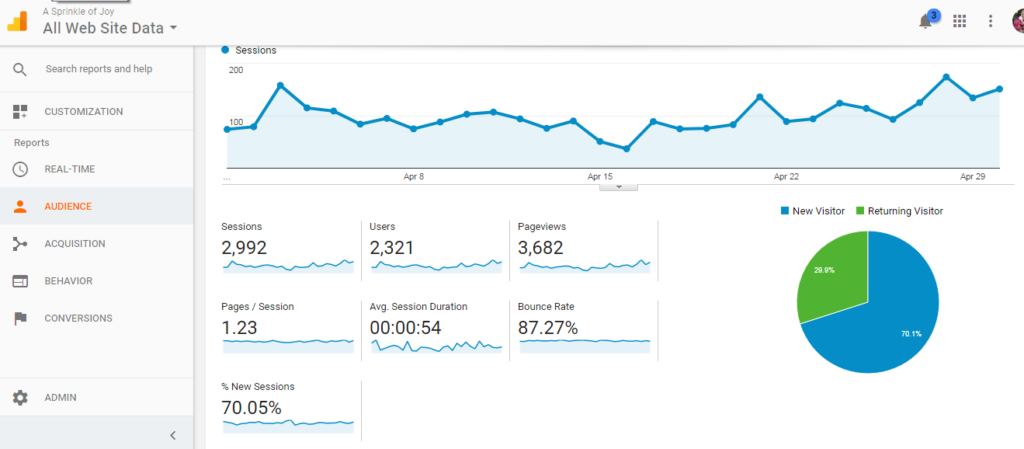
It is the “audience–> overview” view. You can see that my sessions (aka visits) were 2,992, my unique visits (aka users) were 2,321, and my total pageviews were 3,682. This view also shows you how long, on average, people stayed on your site (mine was 54 seconds), and bounce rate (which is how many people click away from your site after visiting).
**Note on bounce rate. From what I read, blogging bounce rates tend to be higher, since many times people come to your blog to read a post, then click away.**
So, for the longest time, that’s all I really cared about, but then I started playing around and realized just what you could do! One think I like to do is change up the time frame. You can look at a month, a week, and even compare time frames.
To change the data range, simply click on the date in the upper right. It will bring down a menu and allow you to change the dates. Let’s say I want to look at June 1st. 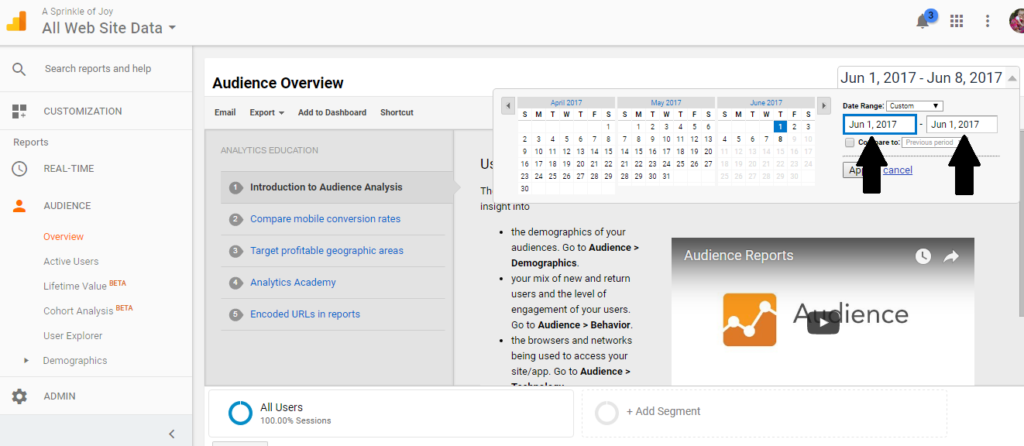
Make sure each box says June 1st, then hit apply. You will get your stats for that one day.
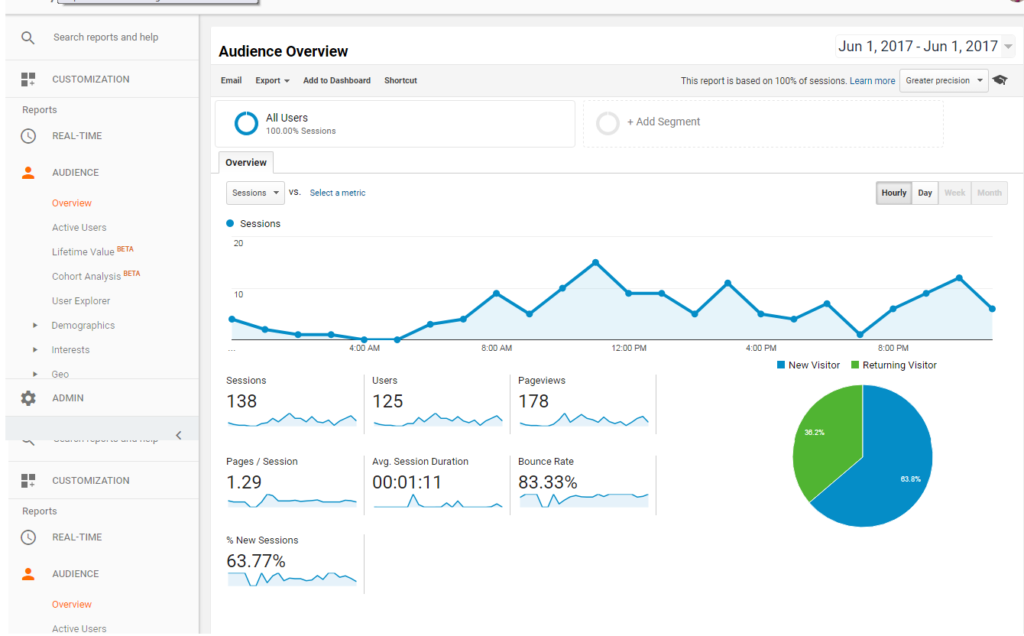
I also like to compare data ranges.
To do this you click the compare to box in your data range. Then select the two ranges you want to compare.
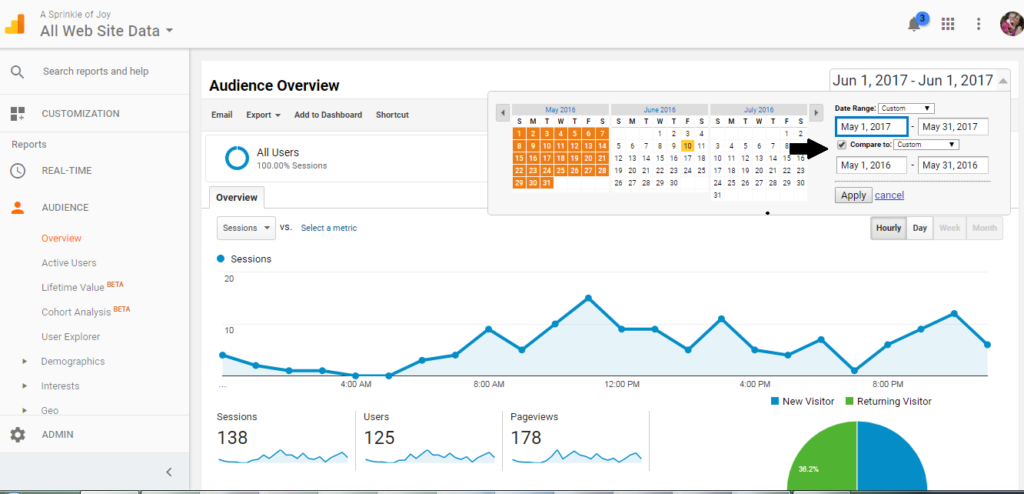
As you can see I am comparing May 2017 to May 2016 (I like to compare my views from this year to last, to remind myself, that while it may not feel like I am growing, I am). Hit apply, and see your awesome graph.
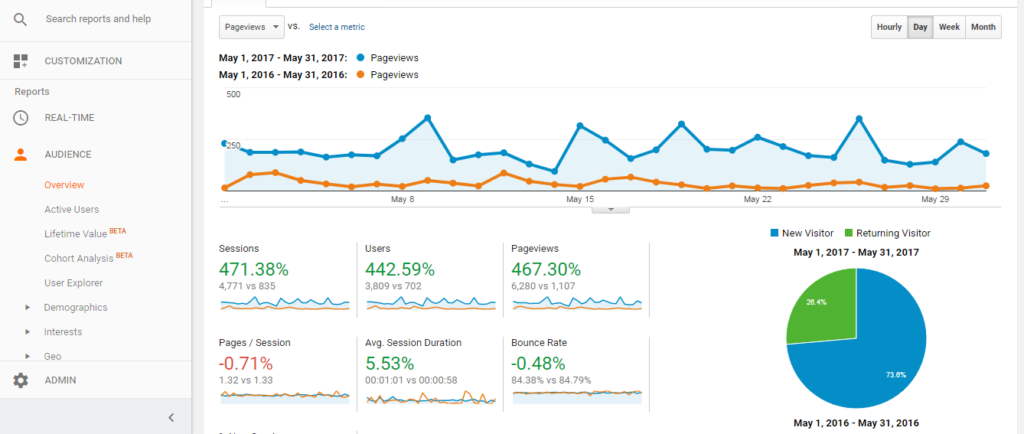
In mine, the orange is May 2016 (1,107 views) and the blue is May 2017 (6,280 views).
Say what?! 6,280 views!? Never before have I had that many views in a month (I am usually around 4k). This prompted me to look more into what the heck happened in May of 2017.
What happened in May of 2017??


![Kids Behind the Blog [January 2017]](https://www.asprinkleofjoy.com/wp-content/uploads/2017/01/TKBTB-Button-300x300-150x150.jpg)

![Idea Box [#84]](https://www.asprinkleofjoy.com/wp-content/uploads/2016/05/IdeaBox_4hosts_2016edit1-150x150.jpg)


